copy deeplink I Tested Positive for COVID-19. Now What? | MCN Isolation, Masking, & Testing Flowchart
I Tested Positive for COVID-19. Now What? | MCN Isolation, Masking, & Testing Flowchart- 2023-5-9_I-Tested-Positive-COVID_Flowchart.pdf (105.16 KB)
- 2023-5-9_I-Tested-Positive-COVID_Flowchart.png (34.13 KB)
- 2023-5-9_He-dado-positivo-a-COVID19-Que-hago-ahora_0.pdf (106.22 KB)
- 2023-5-9_He-dado-positivo-a-COVID19-Que-hago-ahora_imagen_0.png (34.83 KB)
- 2023-6-30_Mwen-te-teste-pozitif-pou-COVID-19_Resous.pdf (102.83 KB)
- 2023-6-30_Mwen-te-teste-pozitif-pou-COVID-19_Resous.png (51.97 KB)
copy deeplink 1999-2013 United States Cancer Statistics Report
1999-2013 United States Cancer Statistics ReportThe 1999–2013 United States Cancer Statistics (USCS): Incidence and Mortality Web-based Report includes the official federal statistics on cancer incidence from registries that have high-quality data, and cancer mortality statistics. It is produced by the Centers for Disease Control and Prevention (CDC) and the National Cancer Institute (NCI). This report shows that in 2013, 1,536,119 Americans received a new diagnosis of invasive cancer, and 584,872 Americans died of this disease (these counts do not include in situ cancers or the more than 1 million cases of basal and squamous cell skin cancers diagnosed each year).
This year’s report features information on invasive cancer cases diagnosed during 2013, the most recent year of incidence data available, among residents of 49 states, six metropolitan areas, and the District of Columbia—geographic areas in which about 99% of the U.S. population resides. Incidence data are from CDC’s National Program of Cancer Registries (NPCR) and NCI’s Surveillance, Epidemiology, and End Results (SEER) Program. Data from population-based central cancer registries in these states and metropolitan areas meet the criteria for inclusion in this report.
The report also provides cancer mortality data collected and processed by CDC’s National Center for Health Statistics. Mortality statistics, based on records of deaths that occurred during 2013, are available for all 50 states and the District of Columbia.
The report also includes incidence rates and counts for Puerto Rico for 2009 through 2013 by sex and age, as well brain tumor and childhood cancer data.
USCS data are presented in the following applications—
- https://nccd.cdc.gov/uscs/?s_cid=govD_USCS2013_1
- http://links.govdelivery.com/track?type=click&enid=ZWFzPTEmbWFpbGluZ2lkPTIwMTYwNzA2LjYxMjE2OTcxJm1lc3NhZ2VpZD1NREItUFJELUJVTC0yMDE2MDcwNi42MTIxNjk3MSZkYXRhYmFzZWlkPTEwMDEmc2VyaWFsPTE3MDg5NzQwJmVtYWlsaWQ9dGx5b25zQG1pZ3JhbnRjbGluaWNpYW4ub3JnJnVzZXJpZD10bHlvbnNAbWlncmFudGNsaW5pY2lhbi5vcmcmZmw9JmV4dHJhPU11bHRpdmFyaWF0ZUlkPSYmJg%3D%3D&101=&https%3A%2F%2Fnccd_cdc_gov%2Fuscs%2F%3Fs_cid=govD_USCS2013_2
- http://links.govdelivery.com/track?type=click&enid=ZWFzPTEmbWFpbGluZ2lkPTIwMTYwNzA2LjYxMjE2OTcxJm1lc3NhZ2VpZD1NREItUFJELUJVTC0yMDE2MDcwNi42MTIxNjk3MSZkYXRhYmFzZWlkPTEwMDEmc2VyaWFsPTE3MDg5NzQwJmVtYWlsaWQ9dGx5b25zQG1pZ3JhbnRjbGluaWNpYW4ub3JnJnVzZXJpZD10bHlvbnNAbWlncmFudGNsaW5pY2lhbi5vcmcmZmw9JmV4dHJhPU11bHRpdmFyaWF0ZUlkPSYmJg%3D%3D&102=&https%3A%2F%2Fnccd_cdc_gov%2FDCPC_INCA%2F%3Fs_cid=govD_USCS2013_3
- http://links.govdelivery.com/track?type=click&enid=ZWFzPTEmbWFpbGluZ2lkPTIwMTYwNzA2LjYxMjE2OTcxJm1lc3NhZ2VpZD1NREItUFJELUJVTC0yMDE2MDcwNi42MTIxNjk3MSZkYXRhYmFzZWlkPTEwMDEmc2VyaWFsPTE3MDg5NzQwJmVtYWlsaWQ9dGx5b25zQG1pZ3JhbnRjbGluaWNpYW4ub3JnJnVzZXJpZD10bHlvbnNAbWlncmFudGNsaW5pY2lhbi5vcmcmZmw9JmV4dHJhPU11bHRpdmFyaWF0ZUlkPSYmJg%3D%3D&103=&https%3A%2F%2Fnccd_cdc_gov%2FStateCancerFacts%2F%3Fs_cid=govD_USCS2013_4
copy deeplink Woman Sitting at Table Reading Newspaper - Images
Woman Sitting at Table Reading Newspaper - Images
- WomanInGreenShirtSittingAtTableReadingNewspaperComicImage.png (82.39 KB)
- WomanElderInGreenShirtSittingAtTableReadingNewspaperComicImage.png (87.57 KB)
- WomanInBlueShirtSittingAtTableReadingNewspaperComicImage_0.png (85.85 KB)
- WomanElderInBlueShirtSittingAtTableReadingNewspaperComicImage_0.png (89.53 KB)
copy deeplink Woman and Man Discussing Hesitancies and Myths - Tracking Chips - Images
Woman and Man Discussing Hesitancies and Myths - Tracking Chips - Images
- WomanElderAndManDiscussingHesitanciesAndMyths.png (70.83 KB)
- WomanGirlAndManDiscussingHesitanciesAndMyths.png (71.02 KB)
- WomanAndManDiscussingHesitanciesAndMyths.png (68.49 KB)
- Chip_And_Vaccine_Comic_With_Bubbles Elder lady.png (40.62 KB)
- Chip_And_Vaccine_Comic_With_Bubbles COLOR2.png (52.09 KB)
- Chip_And_Vaccine_Comic_With_Bubbles COLOR1.png (41.23 KB)
- Chip_And_Vaccine_Comic_With_Bubbles.PNG (42.2 KB)
copy deeplink Documentos técnicos de la OPS - Enfermedad por el Coronavirus (COVID-19)
Documentos técnicos de la OPS - Enfermedad por el Coronavirus (COVID-19)
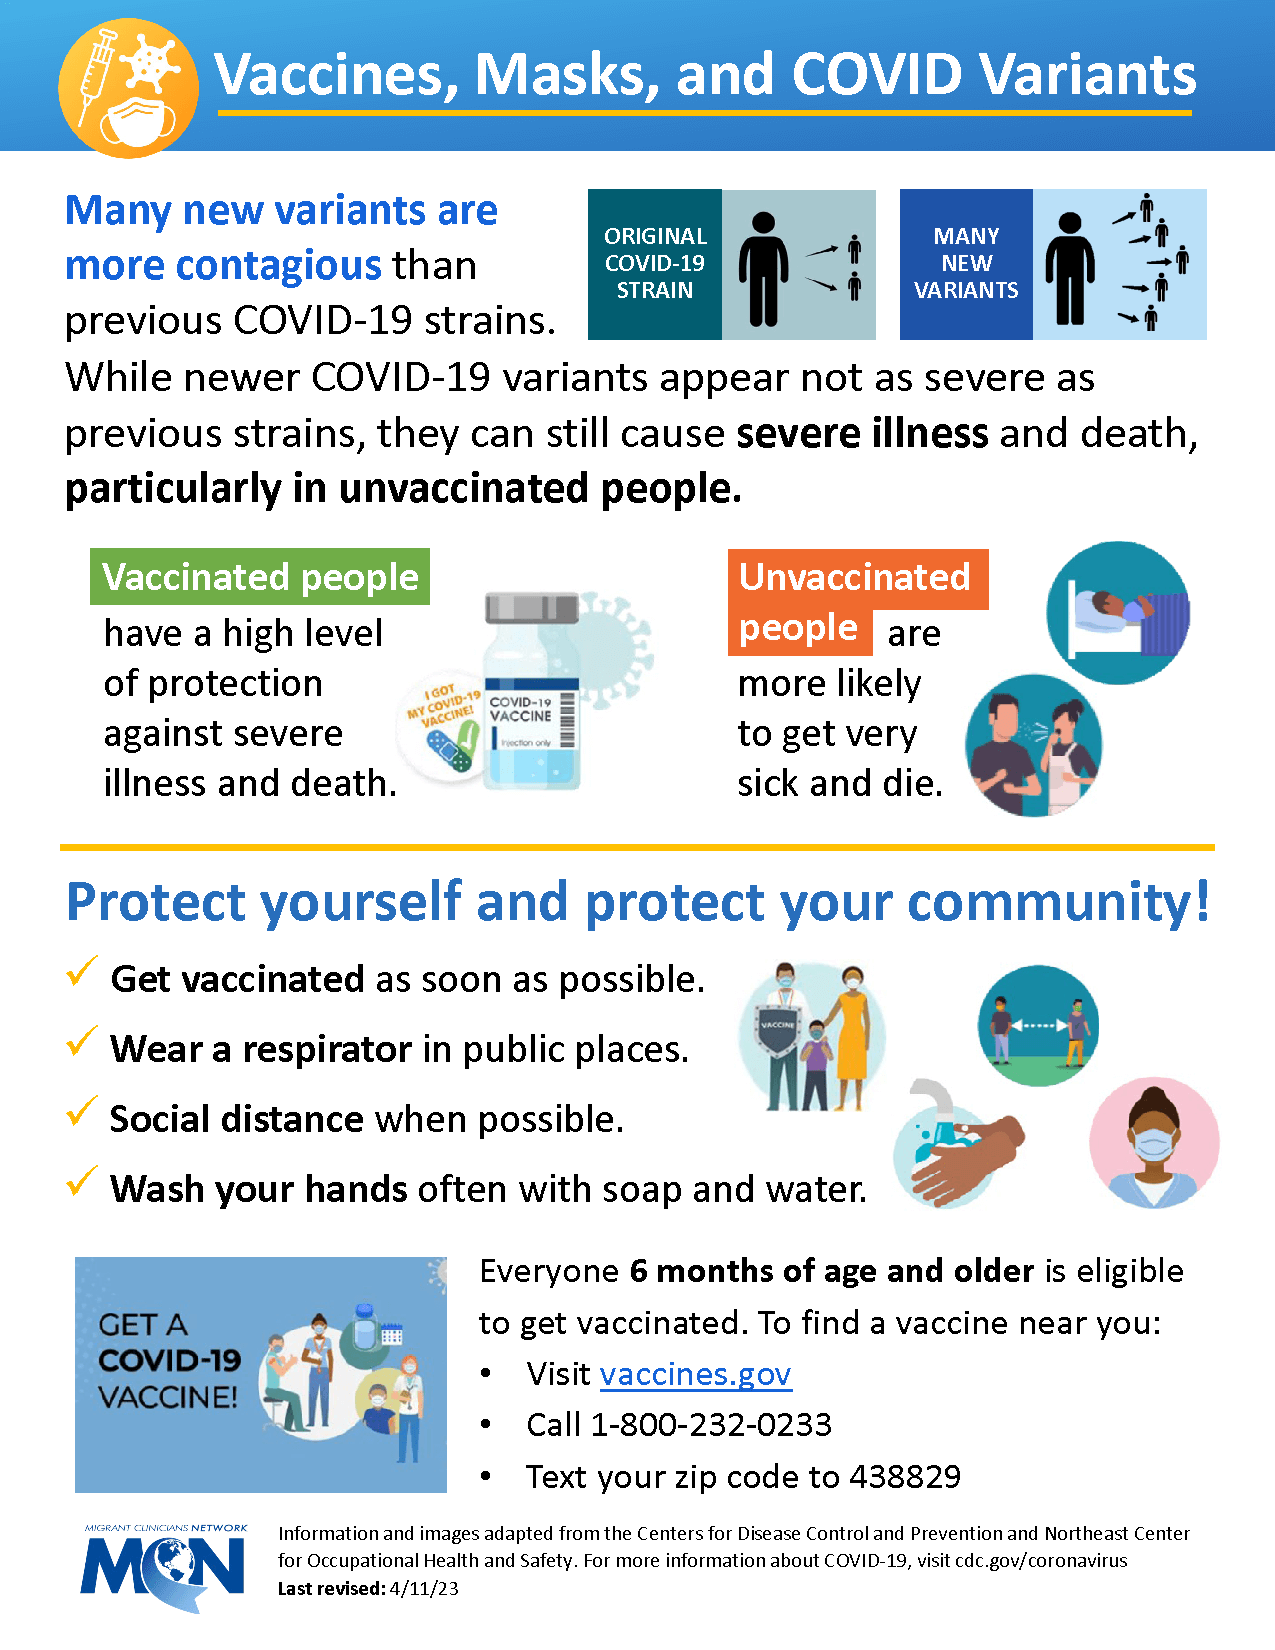
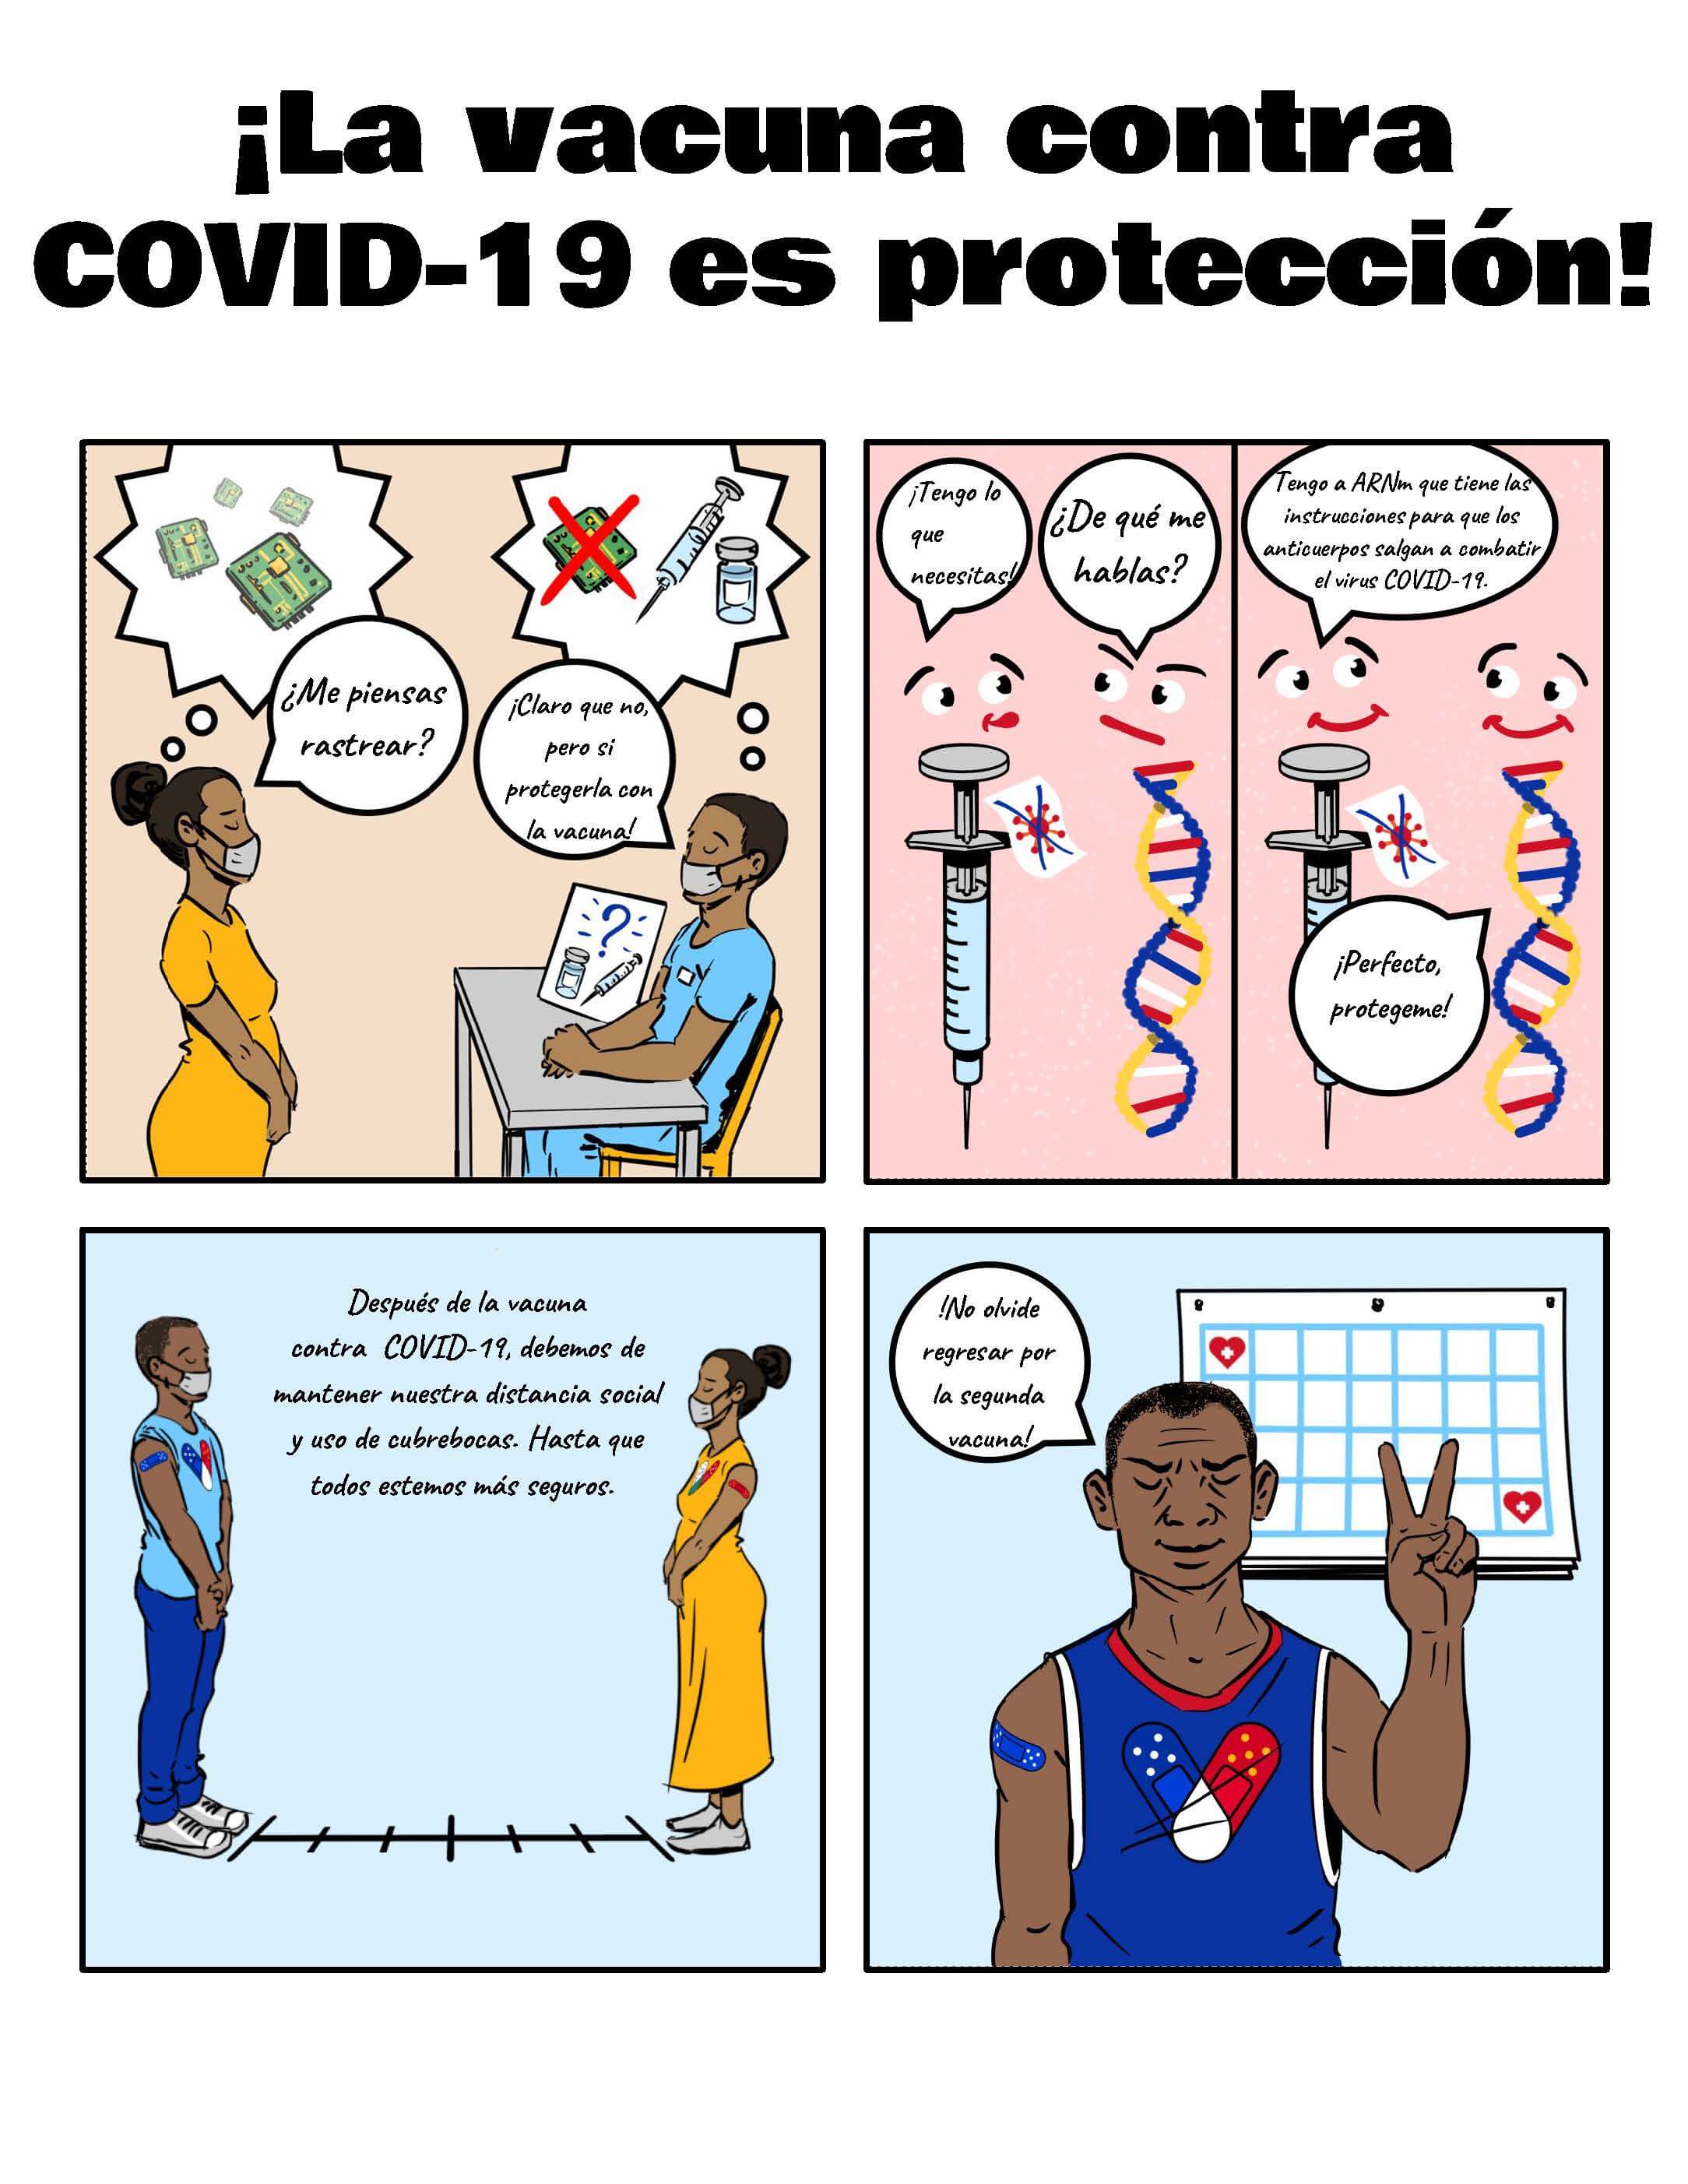
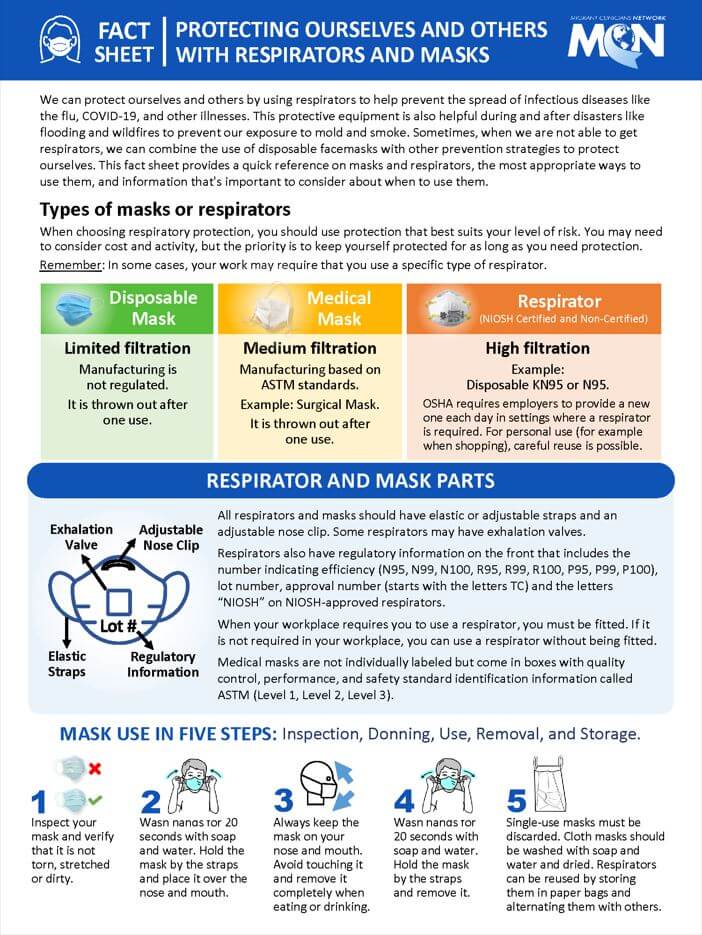
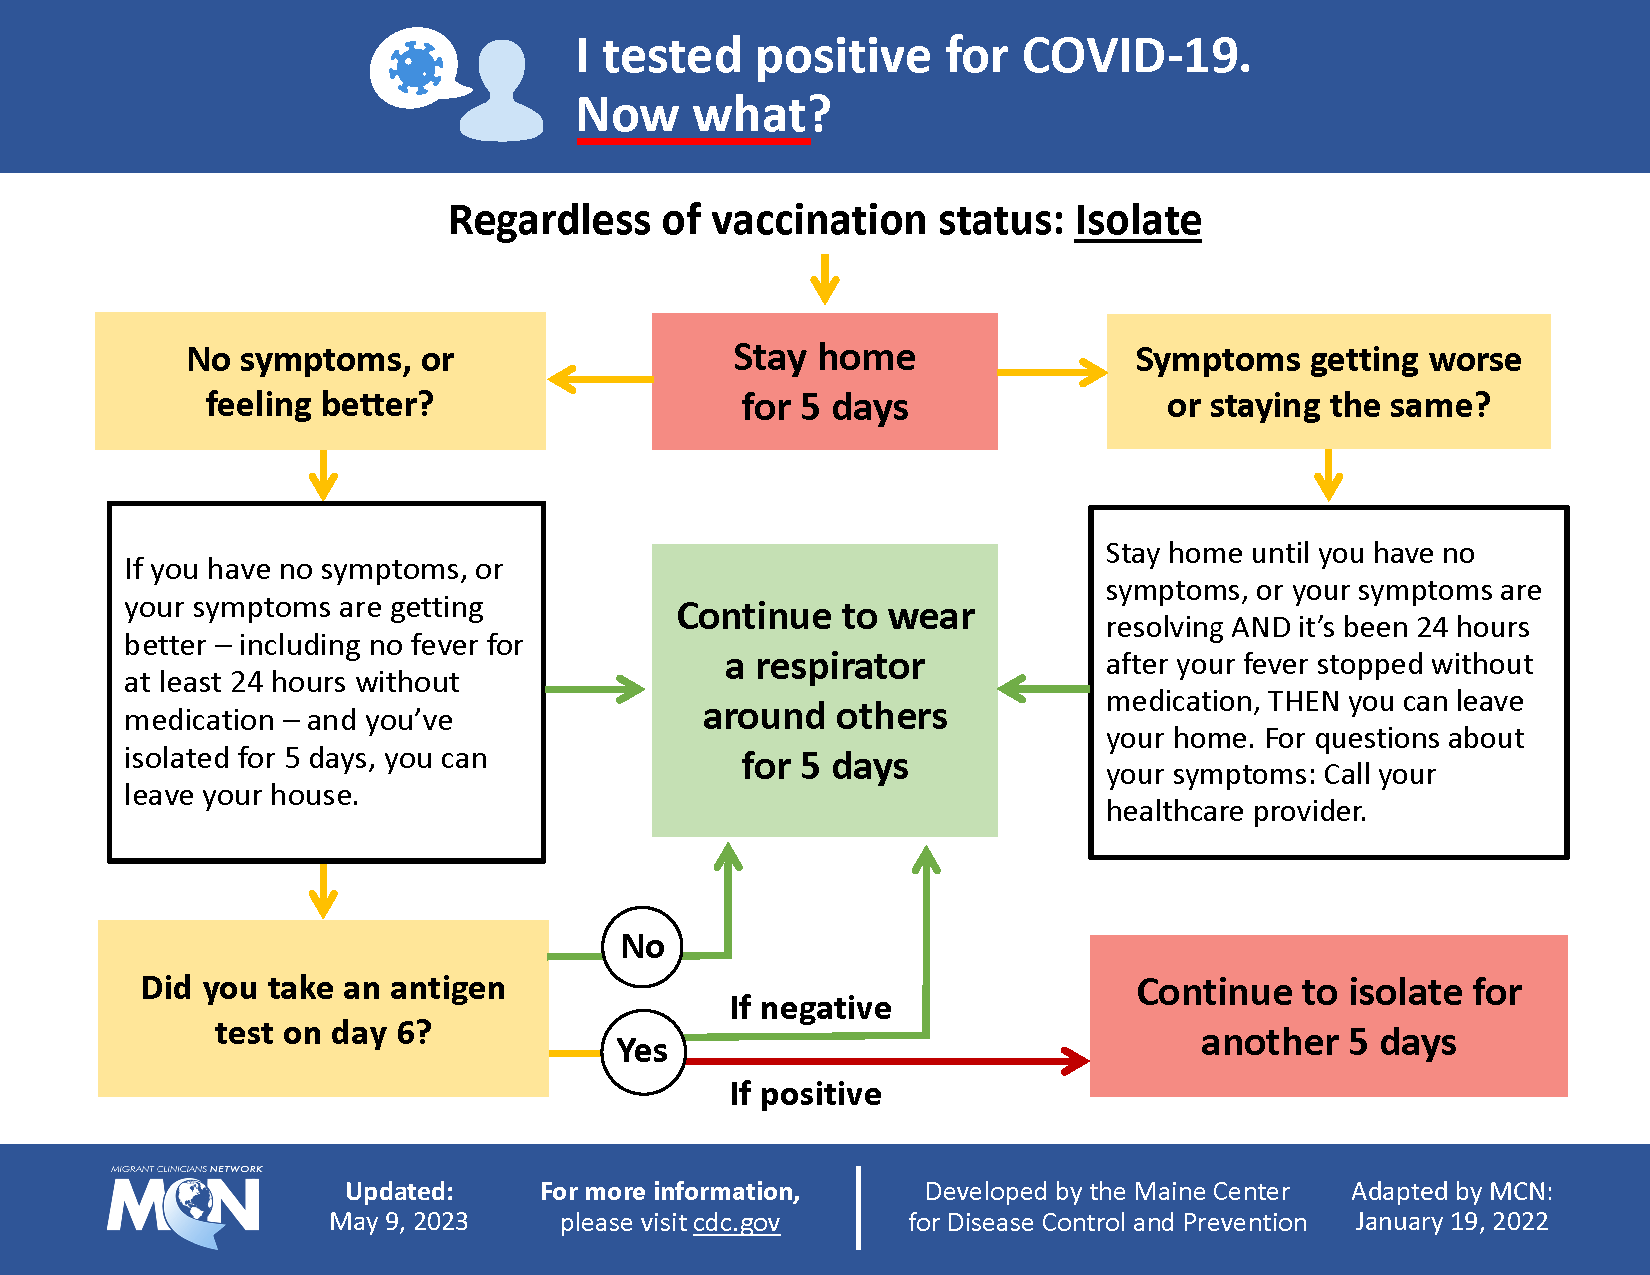
These infographics and social media cards are simple and bright. The order in which the recommendations are presented is great.
copy deeplink Safe Water | Environmental Education Resources
Safe Water | Environmental Education Resources- Contaminacion del agua-Info1-La vuelta al mundo_0.pdf (246.73 KB)
- Contaminacion del agua-Info2-Personalidad_0.pdf (148.16 KB)
- Contaminacion del agua-Info3-Leyes y costumbres_0.pdf (124.07 KB)
- Contaminacion del agua-Info4-En la practica_0.pdf (147.93 KB)
- Contaminacion del agua-Info5-Comic_0.pdf (248.47 KB)
- Contaminacion del agua-Lluvia de ideas_0.pdf (77.55 KB)
- Contaminacion del agua-Organizador grafico_0.pdf (79.69 KB)
- Contaminacion del agua-Quiz_0.pdf (128.38 KB)
- Contaminacion del agua-Vocabulario_0.pdf (75.77 KB)